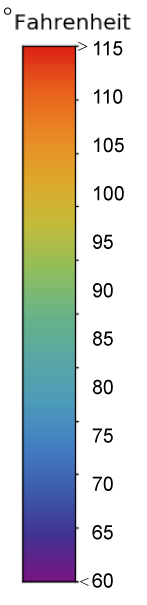
What does Average Daily Maximum Temperature (°F) tell us?
A day’s highest (maximum) temperature usually occurs in the afternoon. Averaging the daily high temperatures over any period results in a mean maximum temperature for that period.
Maximum temperature serves as one measure of comfort and safety for people and for the health of plants and animals. When maximum temperature exceeds particular thresholds, people can become ill and transportation and energy infrastructure may be stressed.
Get startedBack
What does Average Daily Minimum Temperature (°F) tell us?
A day’s lowest (minimum) temperature usually occurs in the early morning, just before sunrise. Averaging the daily low temperatures for any period results in a mean minimum temperature for that period.
Periods of low temperature give plants, animals, and people a chance to recover from daytime heat. When minimum temperatures aren’t sufficiently cool, plant and animal responses can trigger ecosystem changes and increased demand for energy can stress energy infrastructure.
Get startedBack
What does Days per year with Maximum Temperature Above 90, 95, 100, or 105°F tell us?
The total number of days per year with maximum temperature above various thresholds is an indicator of how often very hot conditions occur. Depending upon humidity, wind, and physical workload, people who work outdoors or don’t have access to air conditioning may feel very uncomfortable or experience heat stress or illness on very hot days.
Hot days also stress plants, animals, and human infrastructure such as roads, railroads, and electric lines. Increased demand for electricity to cool homes and buildings can place additional stress on energy infrastructure.
Get startedBack
What does Days per year with Maximum Temperature below 32°F tell us?
The total number of days per year when the highest temperature is less than 32°F (0°C) is an indicator of how often very cold days occur.
Days when the highest temperature doesn’t rise above the freezing point of water are called “icing days.” The annual number of icing days tells us how much rest plants get from growing; with too few icing days, some plants do not perceive a “reset” signal to begin budding or blooming in the spring. The annual number of icing days can also help predict if populations of insects, such as tree-killing bark beetles, will survive the winter or not.
Get startedBack
What does Days per year with Minimum Temperature below 32°F tell us?
The total number of days per year when the temperature dips below 32°F (0°C) is an indicator of how often cold days occur.
A decrease in the number of days temperature drops below freezing promotes earlier spring snowmelt and runoff, with important consequences for managing water resources. Below-freezing temperatures can cause driving hazards, aircraft icing, and damage to infrastructure, yet ski resorts and other winter recreation businesses depend on sufficiently cold days to maintain snowpack. Some plants require a cumulative number of days below freezing before they can begin budding or blooming in the spring.
Get startedBack
What does Days With Minimum Temperature above 80 or 90°F tell us?
The total number of days per year when the lowest temperature doesn’t drop below a given threshold is an indicator of how often very warm nights occur.
When the lowest temperature of a 24-hour period doesn’t dip below 80 or 90°F, plants, animals, and people don’t have a chance to cool down. They can become stressed and susceptible to other negative health impacts. As the number of very warm nights increases, sensitive plants may not produce flowers or viable seeds.
Get startedBack
What does Precipitation tell us?
We evaluate climate over long periods of observation. For example, in 2014, the global temperature was 1.24°F (0.69°C) above the long-term average for the 20th century, according to NOAA's National Climatic Data Center. That number made 2014 the warmest year on record in the NOAA database, which goes back to 1880.
Data source: NOAA, 2015
Get startedBack
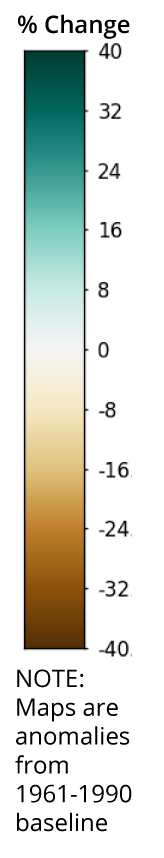
What does Total Precipitation tell us?
Total precipitation over a year, season, or month indicates the average amount of water added to the environment over the indicated period.
The graph for this variable shows total precipitation in inches. To help users perceive trends in this variable over time however, the map shows precipitation as the percentage change from the long-term average (1961 to 1990).
Get startedBack
What does Days with Precipitation Above 1, 2, or 3 inches tell us?
The number of days per year when locations receive more than 1, 2, or 3 inches of precipitation is an indicator of how often very heavy precipitation events occur. This measurement may also be used as an indicator of flood risk.
Comparing the number of days with heavy precipitation at a single location over time can reveal a trend of increasing or decreasing flood risk.
Get startedBack
What does Dry Days tell us?
The number of dry days per year—days when precipitation is less than 0.01 inches—gives a sense of the portion of the year when no moisture is being added to the environment. Changes in the number of dry days can indicate a tendency toward drier or wetter conditions.
The graph for this variable shows counts of Dry Days. To help users perceive trends in numbers of dry days over time however, the map shows dry days as the projected annual number of dry days for each decade minus the 1961-1990 average. Positive values indicate more dry days while negative values indicate fewer dry days.
Get startedBack
What does Derived tell us?
Derived ...
Data source: NOAA, 2015
Get startedBack
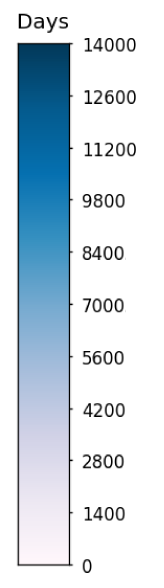
What does number of Heating Degree Days tell us?
The number of heating degree days at any location reflects the amount of energy people use to heat a building when it is cool outside. Lower numbers of heating degree days indicate lower demand for energy.
Heating degree days measure how much (in degrees), and for how long (in days), outside air temperature is below 65°F. For example, on a day when the average outdoor temperature is 35°F, raising the indoor temperature to 65°F would require 30 degrees of heating multiplied by 1 day, or 30 heating degree days. Engineers and utility companies use a location’s annual number of heating degree days as one input when estimating demand for energy in the cold season.
Get startedBack
What does number of Cooling Degree Days tell us?
The number of cooling degree days at any location reflects the amount of energy people use to cool a building when it is warm outside. Higher numbers of cooling degree days indicate higher demand for energy.
Cooling degree days measure how much (in degrees), and for how long (in days), outside air temperature is higher than 65°F. For example, on a day when the average outdoor temperature is 85°F, reducing the indoor temperature to 65°F would require 20 degrees of cooling multiplied by 1 day, or 20 cooling degree days. Engineers and utility companies use a location’s annual number of cooling degree days as one input when estimating demand for energy in the warm season.
Get startedBack
What does number of Growing Degree Days tell us?
The number of growing degree days per year is used to estimate the growth and development of plants (or insects) during the growing season. Higher numbers of growing-degree days indicate longer and warmer growing conditions.
As growth occurs only when temperature exceeds a species’ base temperature (for example, 50°F), the number of days times the number of degrees above the base indicates the duration and magnitude of growing conditions.
Get startedBack
What does number of Modified Growing Degree Days tell us?
Corn growers use the number of modified growing degree days to monitor the development of corn crops.
As corn development occurs only when temperature is above 50°F but below 86°F, the standard calculation for growing-degree days is modified to omit conditions outside this range. In future decades, regions where temperatures regularly exceed 86°F may be less successful in growing corn.
Get startedBack